



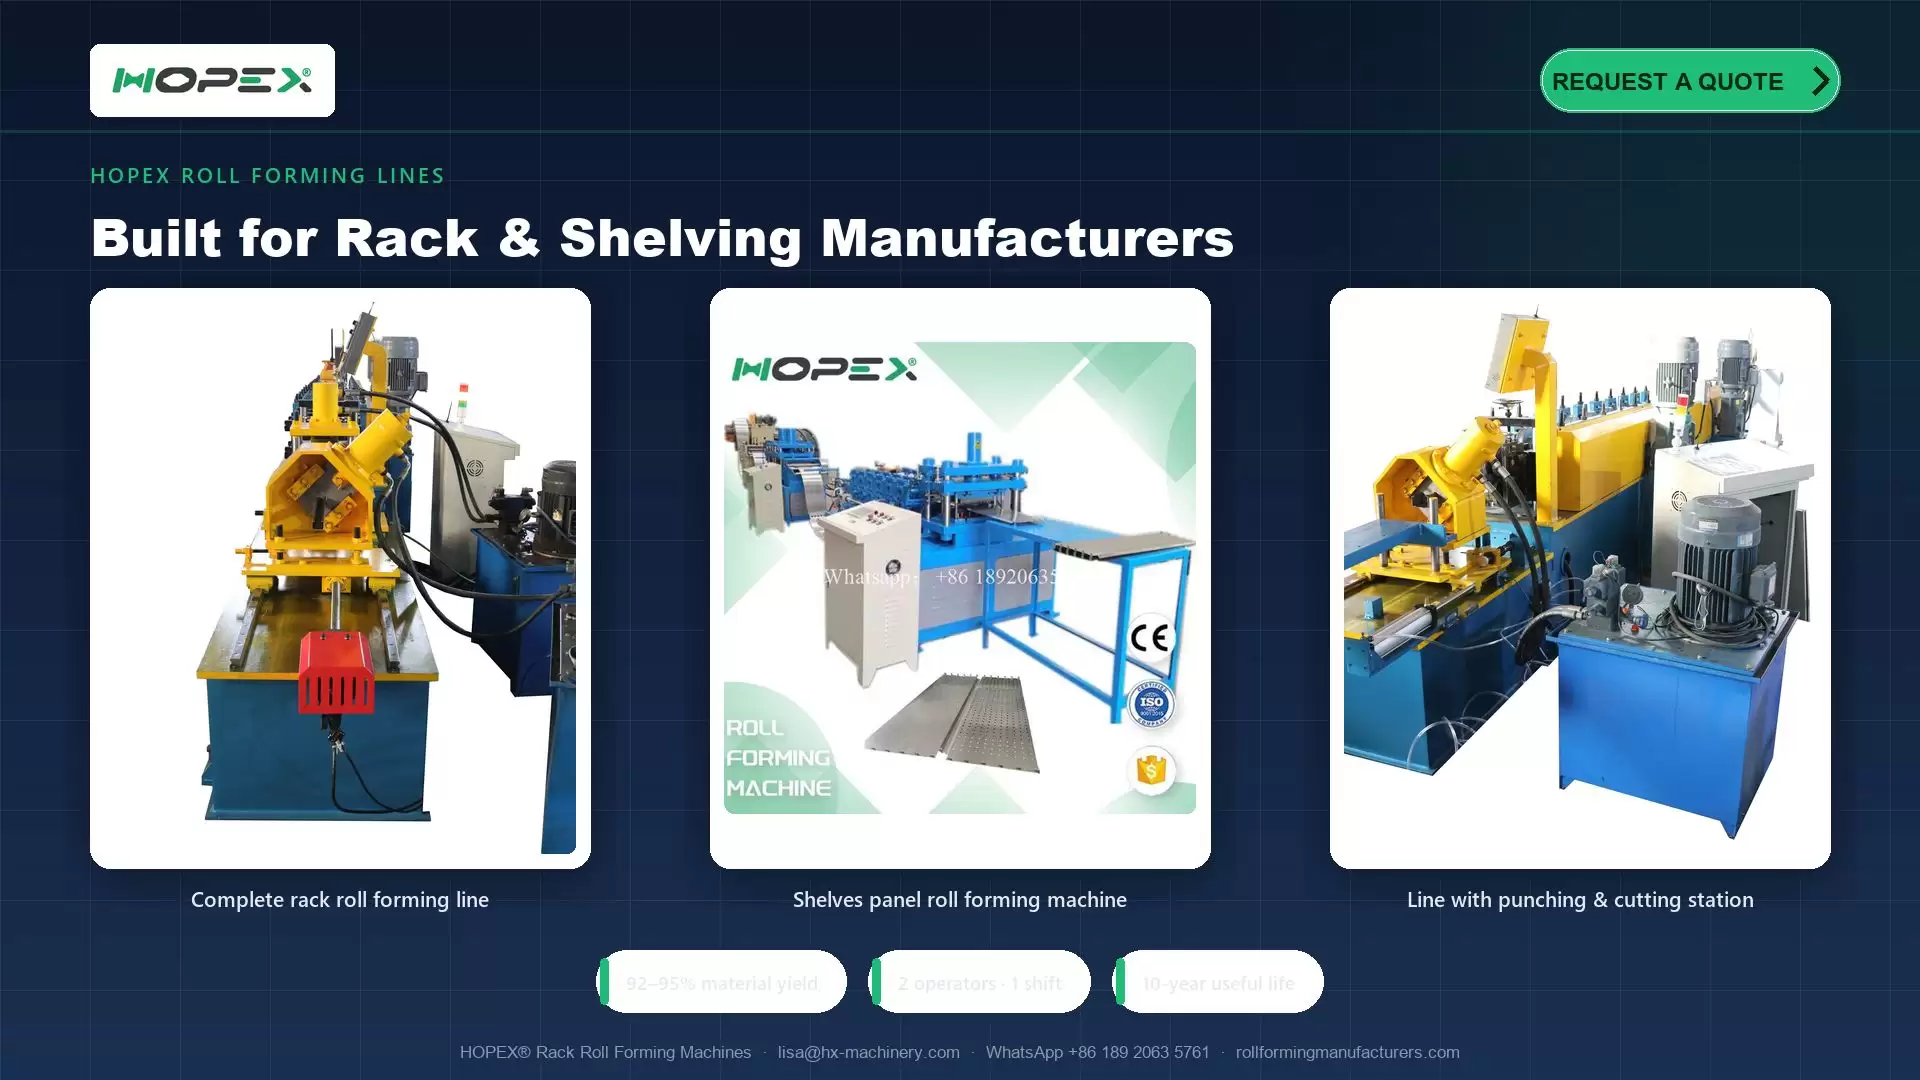
A rack roll forming machine purchase rarely gets blocked by technical objections — it gets blocked in the finance committee. This article gives you the analytical framework, the numbers, and the narrative to make the case internally.
The Right Frame for the ROI Argument
Most manufacturers frame the rack machine investment as a cost reduction: "We'll save X per unit by producing in-house." Finance teams are familiar with this framing and will immediately ask for a sensitivity analysis on your cost assumptions.
A stronger frame — and one that is harder to argue against — is capacity ownership: "This machine gives us the ability to fulfill orders that we currently decline, and to do so at a margin we control."
The difference is significant: a cost reduction argument depends on your current supplier pricing holding steady. A capacity ownership argument is true regardless of what happens to outsourced component prices.
Use both, but lead with capacity ownership.
Building the Cost Comparison Model
Step 1: Calculate your current sourcing cost
Gather the last 12 months of purchases for each of the four racking components: uprights, beams, braces, and crossbeams. For each:
- Total tons purchased
- Average price per ton (or per piece) paid
- Total spend
This is your baseline — the cost the machine investment will displace.
Step 2: Calculate in-house production cost
In-house production cost has four components:
Example for a mid-size upright production line:
- Machine cost: $280,000
- Annual depreciation: $28,000
- Annual labor (2 operators, 1 shift): $36,000
- Annual energy (45 kW average draw, 2,000 hours): $9,000
- Annual steel coil (500 tons × $680/ton): $340,000
- Total annual in-house cost: $413,000
If you were previously buying 500 tons of finished uprights at $950/ton (including delivery): previous annual cost = $475,000
Annual saving: $62,000 Simple payback on $280,000 investment: 4.5 years
This is a conservative scenario — it does not account for the margin you gain on additional sales enabled by in-house production, or the volume growth that typically follows when you control your own supply chain.
The Capacity Ownership Multiplier
The calculation above treats the machine as a pure cost displacement tool. The real financial value becomes visible when you factor in the orders you can now win that you previously had to decline or subcontract.
Consider a racking manufacturer with a $3.5M annual revenue who currently buys all four components externally:
- Component purchases represent 55% of revenue = $1.925M
- In-house production reduces this to 40% = $1.4M
- Annual saving on current volume: $525,000
But more importantly: with in-house production, this manufacturer can quote shorter lead times, offer custom profiles without minimum order constraints, and improve gross margins by 8–12 percentage points on new projects. A 15% revenue growth rate (achievable when you can fulfill orders faster than competitors) adds $525,000 in new revenue annually, with the incremental gross margin flowing through almost entirely to profit.
The machine does not just save money — it unlocks revenue that the previous supply chain made impossible to capture.
Sensitivity Analysis for Finance
Finance teams will challenge your assumptions. Anticipate these objections:
"What if steel prices drop and our current supplier reduces their quote?" In-house production cost tracks steel price — if coil prices fall, your in-house production cost falls proportionally, maintaining the spread.
"What if our production volume doesn't reach forecast?" The machine investment breaks even at 60–65% of projected volume in most scenarios. Run the model at 60%, 80%, and 100% of volume and present all three.
"What if the machine requires more maintenance than projected?" Budget 2–3% of machine cost annually for maintenance (spare parts, consumables, servicing). For a $280,000 machine, this is $5,600–8,400/year — a manageable line item.
What to Include in Your Board Presentation
- Current state: total spend on external component sourcing for last 12 months
- Machine specification: production capacity vs. your current needs
- Financial model: 3-scenario analysis (60% / 80% / 100% volume)
- Payback timeline: simple payback + NPV at your hurdle rate
- Capacity upside: revenue enabled by shorter lead times and custom profile capability
- Risk mitigation: what happens if one scenario assumption is wrong
We go into deep detail on the component-by-component production requirements in our article Rack Roll Forming Machine | Storage Rack Production Equipment — useful background reading before you build your model.
For equipment pricing and production specifications to populate your model, contact HOPEX or explore our Rack Roll Forming Machine product range.
